18/06/2011

Flexoelectricity

The nematic medium does not exhibit spontaneous polarization due to the apolar nature of the director. A macroscopic polarization can be induced in a nematic liquid crystal by splay and bend distortions of the director field. This was first shown by Meyer in 1969. According to Meyer’s model only nematics made of polar molecules with shape anisotropy can be expected to exhibit flexoelectricity. For example, a nematic consisting of pear shaped molecules with longitudinal dipole moments become polarized under splay distortion  and a nematic made of banana shaped molecules with transverse dipole moments becomes polarized under bend distortion. In the undistorted state, the dipole moments of the molecules are oriented with equal probability in opposite directions. They cancel each other and the net dipole density is zero. 

Let a nematic be made of pear or wedge shaped molecules with longitudinal dipole moments [Figure 4.1(a)]. If the system is deformed with splayed director [Figure 4.1(b)], the efficient packing of the molecules generates a net dipole moment, resulting in a macroscopic polarization. A similar type of effect is also observed in a nematic made of banana shaped molecules with transverse dipole moments [Figure 4.2(a)] subjected to a bend distortion [Figure 4.2(b)].

Figure 4.1: A nematic consisting of pear-shaped molecules with longitudinal dipole moments becomes polarized under splay deformation 


Figure 4.2: A  nematic consisting of banana-shaped molecules with transverse dipole molecules becomes polarized under bend distortion


There have been several techniques to measure the flexoelectric coefficients of nematics. Dozov et. al. devised a simple experimental technique using Hybrid Aligned Nematic (HAN) cell. In HAN cell bottom plate is coated for homogeneous alignment and the top plate is coated to get homeotropic alignment. The anchoring at the two surfaces is assumed to be strong. The director field in such a cell has a permanent splay-bend distortion, which generates flexoelectric polarization. Two wire electrodes are used as spacers to apply a field perpendicular to the plane of the distorted director.  At the bottom plate, the director is along the X axis and the tilt angle reduces continuously on moving towards the upper plate where the director is oriented along the Z axis. The tilt angle θ is a function of the coordinate z. If a uniform dc electric field E is applied along the Y axis, a twist distortion is produced in the medium due to the action of E on polarization. Under the action of E, the director continuously twists, getting a component along the Y axis with the twist angle φ also being a function of z.


Figure 4.3: Side view of the HAN cell.Arrow indicates the field direction


Figure 4.4: Side view of the HAN cell. Arrow indicates the field direction and length indicates the strength of field.


03/06/2011

Simulation of TN Cell

Figure 3.1: 

Figure 3.1 shows the V-T characteristic of TN cell. The characteristic is changing for various values of K33/K11. Here only K33 is changing and all other parameters including K11 are fixed. Surprisingly  the transmittance (T) is increasing just above the threshold voltage for higher values of K33.

Figure 3.2:

Figure 3.2 is a closer look of Fig 3.1 for better visualization. 


Figure 3.3:


Figure 3.3 shows the gradient of transmittance (dT/dV) as a function of applied voltage for various K33


Figure 3.4: Director (θφ) profile as a function of unit thickness (z/L) for different applied voltages. K33/K11 = 1.0 is fixed. 


Figure 3.5: dφ/dz as a function of z/L for various applied voltages. K33/K11 = 1.0 is fixed.  


Figure 3.6: Director (θφ) profile as a function of unit thickness (z/L) for different applied voltages. K33/K11 = 2.0 is fixed.


Figure 3.7: Director (θφ) profile as a function of unit thickness (z/L) for different applied voltages. K33/K11 = 2.50 is fixed.


Figure 3.8: dφ/dz as a function of z/L for various applied voltages. K33/K11 = 2.5 is fixed.


________________________________________________________________________________________________________


Now we increase thickness of the TN cell to get the maximum transmittance following Gooch-Tarry condition: Δnd = 0.476 μm for λ = 550 nm. 


Figure 3.9: Red dot indicates the threshold voltage


Figure 3.10:


Figure 3.11: 


01/06/2011

Director Deformation of Twisted Nematic Cell

The twisted nematic (TN) display is made up of a nematic liquid crystal which has an optic axis that undergoes a 90° twist, in between two substrates. Each substrate is coated with a conductive transparent electrode, indium tin oxide (ITO), which is then coated by a surfactant that is rubbed parallel to the substrate to create groves for the liquid crystal to align in. The optic axis of the liquid crystal undergoes this twist because the two substrates are placed so the rub directions are at 90° angles to one another. In the normally white (NW) mode of operation the optic axes of the polarizers along each side of the substrate are crossed. It is called normally white because in the unactivated state the display is transparent. In the normally black mode of operation the optic axes of the polarizers are parallel. In the unactivated state the display is black.[1]

Figure 2.1: 

Figure 2.2: 

Figure 2.3: 

Figure 2.4:  

Figure 2.5: 

Figure 2.6: 


Figure 2.7: 


31/05/2011

Director Deformation of Planar LC Cell

The nematic (N) phase is the simplest known phase among all the liquid crystalline phases. The distribution of the centers of the mass of the molecules in the medium is liquid like. In the nematic phase the molecules have a long range orientational order but no translational order. Usually, nematic liquid crystals made of rod-like molecules have cylindrical symmetry i.e. uniaxial. The long axes of the molecules are on an average oriented about a specific direction, which is denoted by a unit vector n, called the director. The nematic director n is a dimensionless apolar vector i.e., n and -n are indistinguishable.

 Figure 1.1: Schematic diagram of the molecular distribution in the nematic phase, and n is the director.

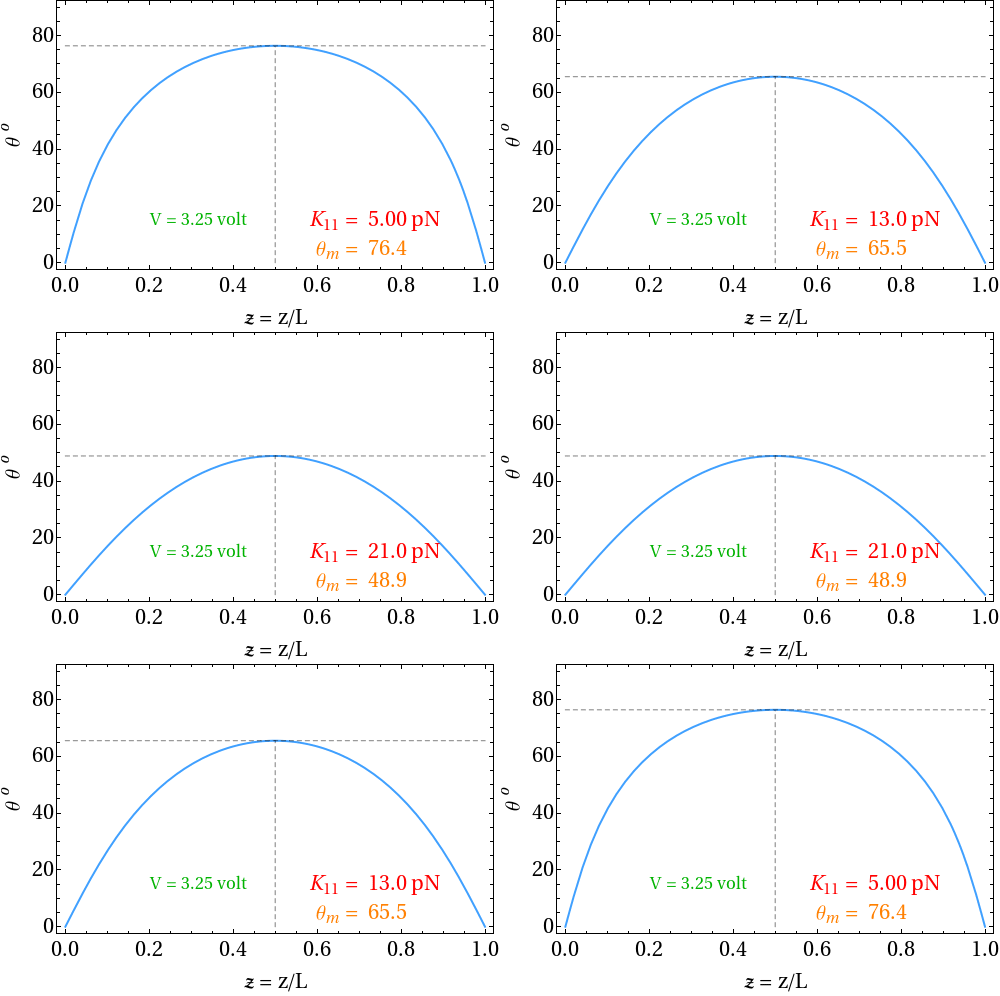
The liquid crystal is enclosed between two conducting glass plates with a gap L. Let the plates lie in the x-y plane and the director n be parallel to the x-axis. The dielectric anisotropy Δϵ of the liquid crystal is positive. If an electric field E is applied along the z-axis, the dielectric energy is lowered by a tilting of the director. In the most general case, the director is anchored on both the surfaces with a pretilt angle θ(0) = θ(L). The tilt angle θ(z) is a function of the coordinate z and reaches a maximum value θm at z = L/2. The gradient of the tilt angle of the director increases the elastic energy. There are four possible boundary conditions depending upon the anchoring energy and the pretilt at the surface of the cell.
  1. Zero pretilt angle and infinite surface anchoring energy : The angle at the surface is independent of electric field [θ(0) = θ(L) = θ0 = 0].
  2. Zero pretilt but finite anchoring energy : The angle at the surface is a function of the electric field, θ0 = θ(V).  
  3. Non-zero pretilt but infinite anchoring energy : The angle at the surface is fixed (θt = pretilt angle) and independent of electric field.
  4. Both non-zero pretilt and finite anchoring energy : With an applied electric field the angle at the surface deviates. This deviation increases with the field.
Only with the first boundary condition, a perfect Fréedericksz threshold voltage can be obtained.


 Figure 1.2: The distribution of director field under an applied electric field. The glass plates are shown in 2D while the director profile in the interior of the cell is shown only in one plane.

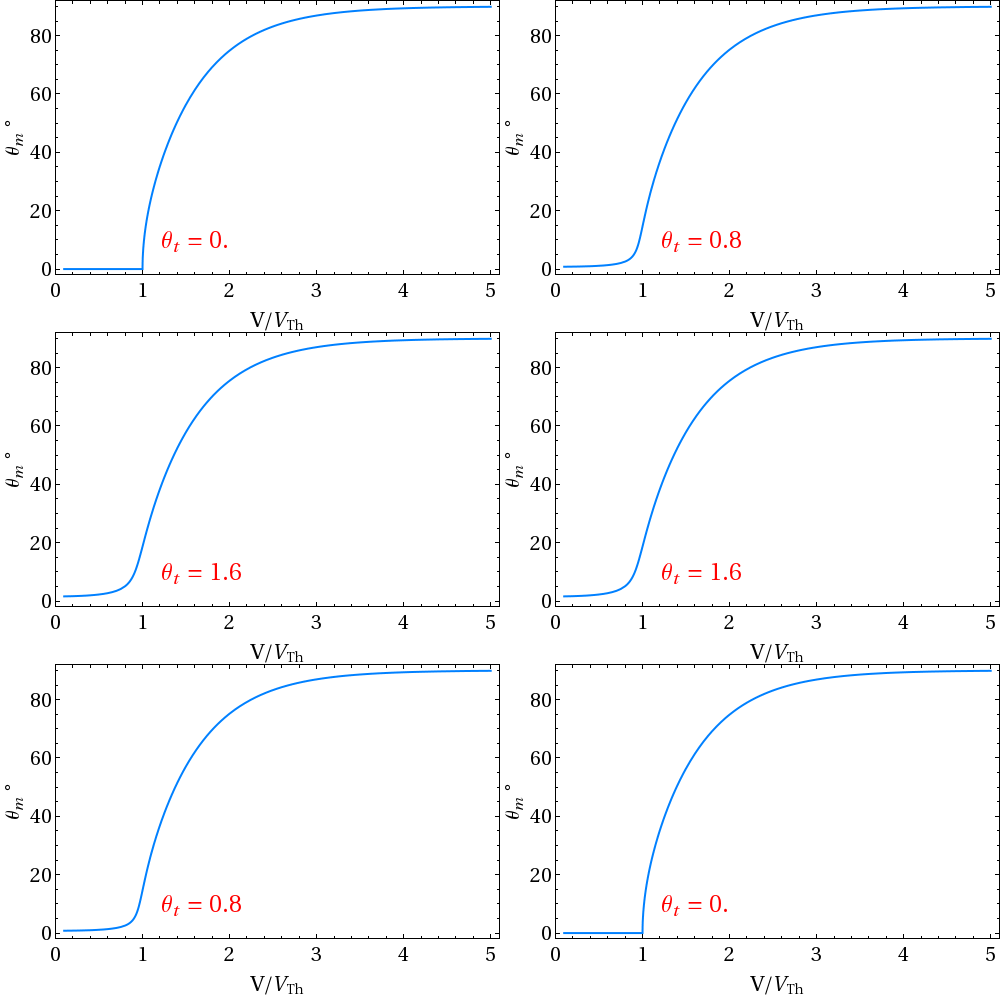
  • Here we consider the 1st boundary condition i.e. zero pretilt angle and infinite surface anchoring energy. Director does not deform as long as applied electric field exceeds Fréedericksz threshold voltage. The mid-plane angle θm reaches 90o under high electric field.

Figure 1.3: Variation of mid-plane polar (tilt) angle θas a function of applied voltage

Figure 1.4: Animation of director deformation under electric field

Figure 1.6: Animation of director profile under electric field

Figure 1.6: Gradient of polar angle as a function of reduced thickness (z/L).


  • Now we consider a condition of finite pretilt angle (say θt = 5o) and infinite anchoring energy.

Figure 1.7: Director deforms even at VVTh i.e. there is no threshold voltage.


Figure 1.8: Animation of director profile at fixed applied voltage (> VTh) for various splay elastic constant


Figure 1.9: Gradient of polar angle at fixed applied voltage (> VTh) for various splay elastic constant


Figure 1.10: Animation of director profile at fixed applied voltage (> VTh) for various bend elastic constant


Figure 1.11: Gradient of polar angle at fixed applied voltage (> VTh) for various bend elastic constant